Data and scaling
Data formats
Every heatmap takes a plain array of values keyed by cell: dates for the calendar, tile keys for tile layouts, and state abbreviations or names for the U.S. States layout.
// Calendar
['2026-10-01' => 4, '2026-10-02' => 17]

// Tile and U.S. States
['CA' => 1284, 'TX' => 894, 'GA' => 542]
Values may be integers, floats, numeric strings, or null. Numeric strings, which many
database drivers return for aggregates, are cast to numbers. Any other value throws an
InvalidArgumentException.
A calendar accepts any key that Carbon can parse as a date, so 2026-10-06 13:30:00 counts
toward October 6. Values for the same day are added together, and dates outside the visible
range are ignored. A key that is not a date throws an InvalidArgumentException. Tile keys
work the same way through the layout, as described in Tile.
Zero and missing values
An explicit 0 and a missing value mean different things, and Thermal keeps them apart:
- Zero — the cell was measured and nothing happened. It is drawn solid gray.
- Missing — there is no data for the cell, either because its key is absent or because
its value is
null. It is drawn as an outline, and its description says "no data".
Many queries leave out days or tiles with no activity rather than returning 0 for them.
When an absent key should count as a value, set it with fillMissing:
// Widget
protected int | float | null $fillMissing = 0;

// Entry
CalendarHeatmapEntry::make('activity')->fillMissing(0);
Leave it as null, the default, to keep those cells missing.
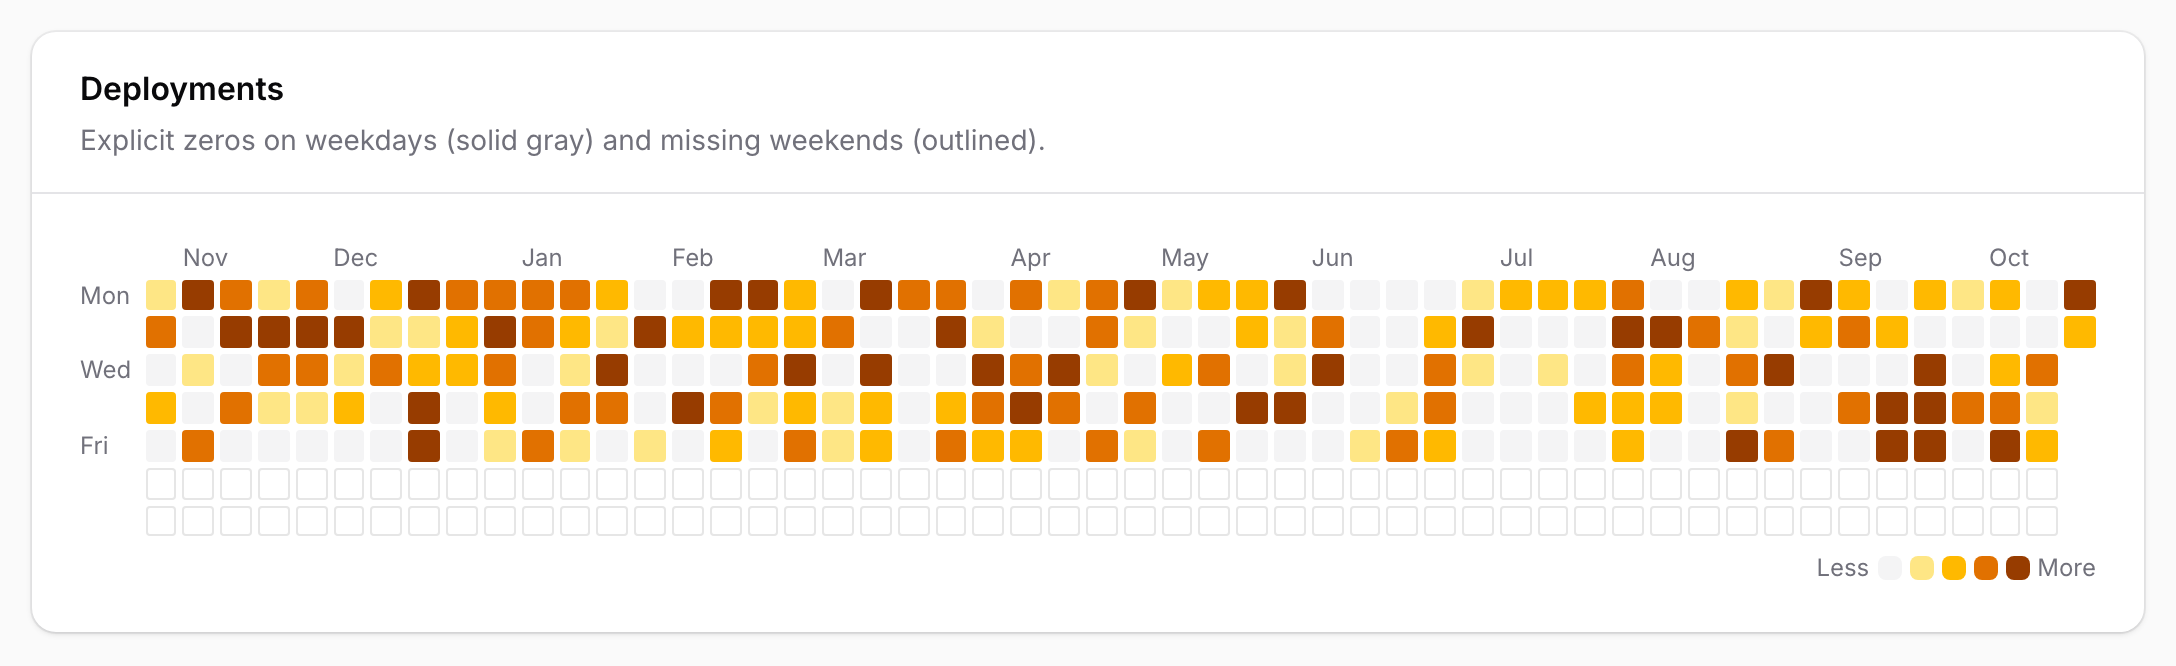
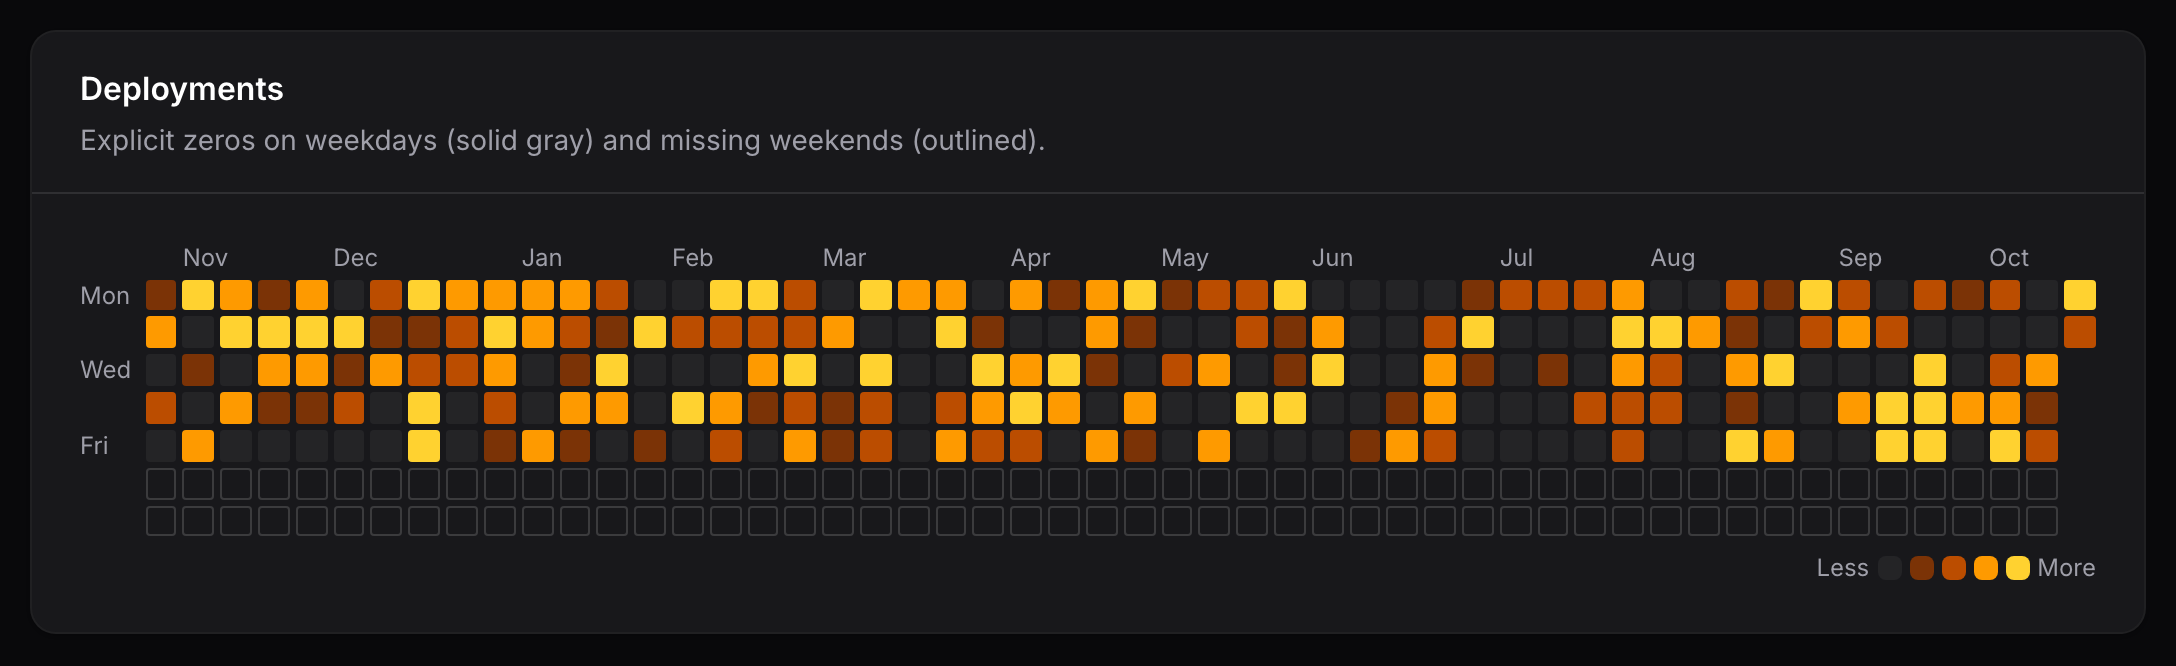
In this calendar, weekdays report a value or an explicit zero, and weekends report nothing. The zero days are solid gray squares and the missing weekend days are outlined:
Intensity levels
Each cell is drawn at one of five levels. Level 0 is the baseline for zero, negative and missing values, and levels 1 to 4 are the populated levels. The legend shows all five.
Automatic scaling
By default, Thermal ranks the distinct positive values in the visible data and splits them into quartiles. The largest value always reaches level 4.
Two simpler approaches were evaluated and rejected as the default:
- Linear of the maximum divides the range from zero to the largest value into four equal bands. A single outlier ruins it: with daily values of 3 to 24 and one launch day of 10,000, every day except the launch lands on level 1.
- Quantiles of all values handles outliers, but heavily repeated values break it: if 50 of 53 days have a value of 1, every threshold collapses onto 1 and the remaining days can no longer be told apart.
Ranking the distinct values handles both cases, so it is predictable on skewed data, on sparse data and on data with many duplicates. In the outlier example above, the daily values spread across levels 1 to 4, and the launch day sits at level 4 with the busiest ordinary days.
This calendar includes one launch day of 5,000 downloads. The rest of the year still spreads across all four levels:
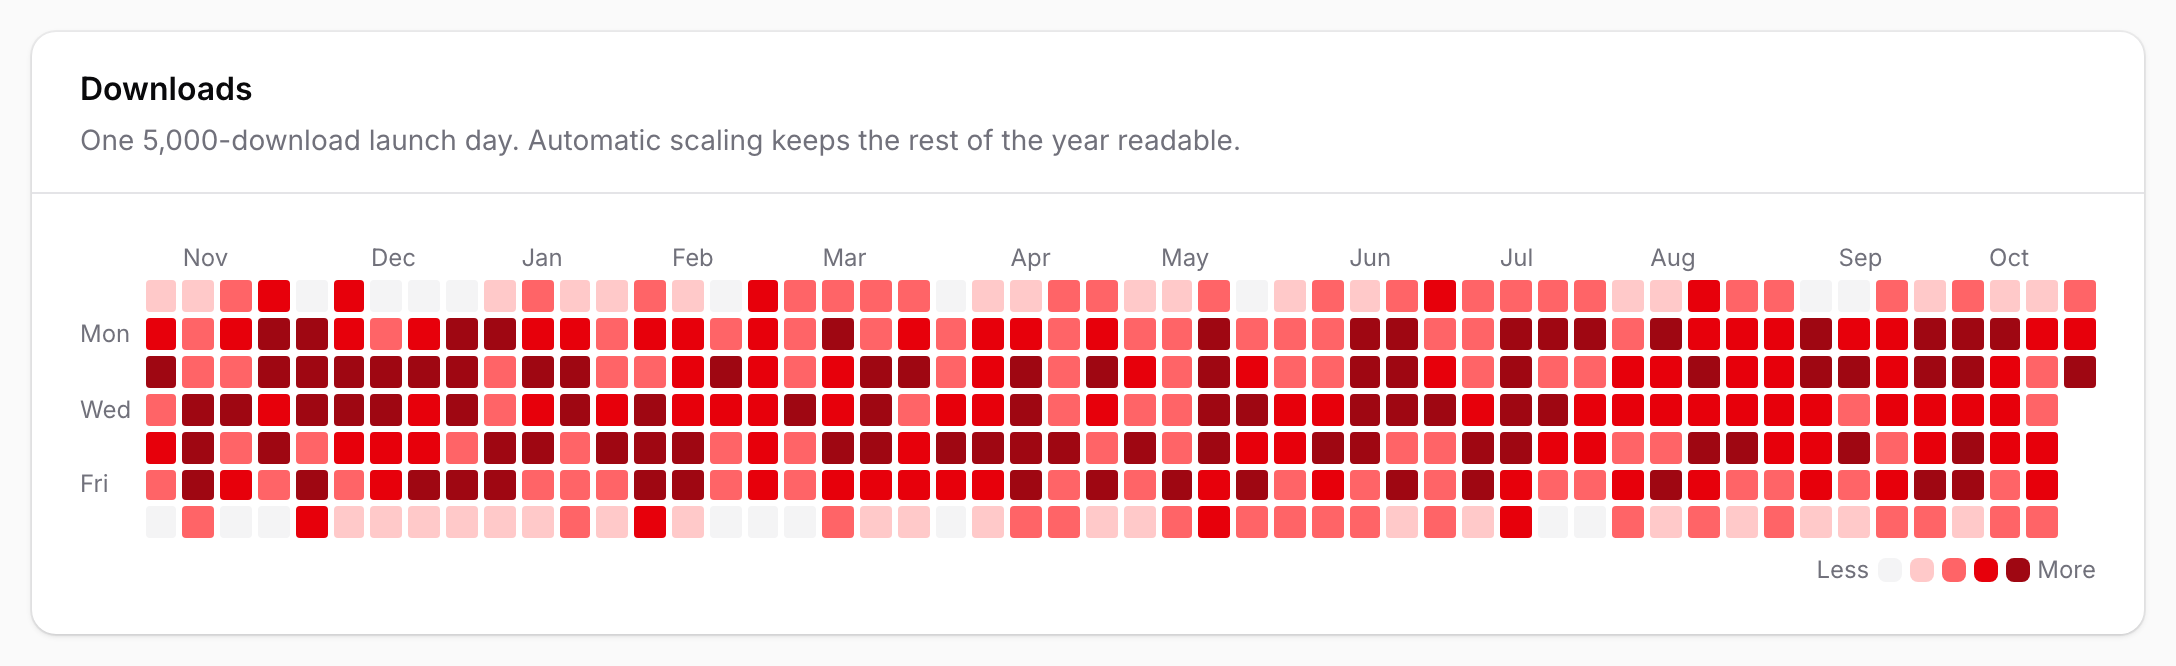
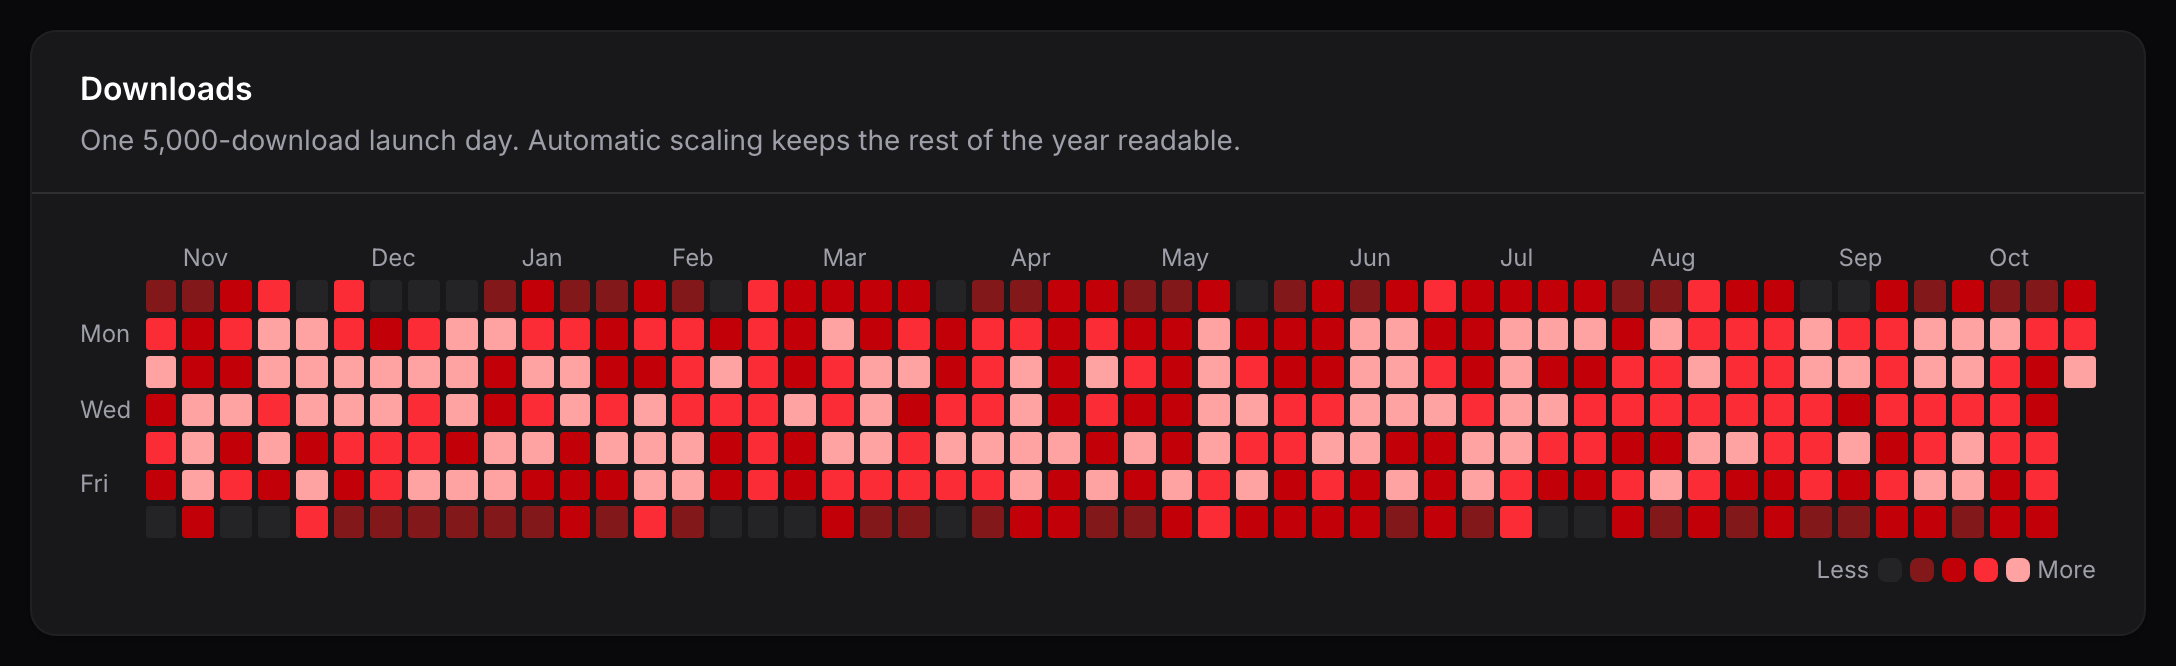
The trade-off is that levels describe rank, not magnitude: level 4 means "among the highest values shown", not "close to the maximum". When the actual size of the values matters, use custom thresholds.
Custom thresholds
Thresholds are the minimum value of each populated level, in ascending order. Return them
from getThresholds() on a widget:
protected function getThresholds(): ?array
{
    return [100, 250, 500, 1000];
}
or pass them to thresholds() on an entry:
UsStatesHeatmapEntry::make('leads')->thresholds([100, 250, 500, 1000]);
With these thresholds, 250 to 499 is level 2 and anything from 1,000 up is level 4. Positive values below the first threshold, such as 40, sit at the baseline with zero.
You may give between one and four thresholds. With fewer than four, the upper levels are
not used: [10, 20] puts values from 20 up at level 2. Thresholds must be numbers greater
than zero in strictly ascending order, or an InvalidArgumentException is thrown.